This page was updated by Dr. S.Aravamudhan on May 22, 2011 at SHILLONG

CLICK on the image to display webpage of aravamudhan: http://www.ugc-inno-nehu.com/
DR.S.ARAVAMUDHAN
http://www.ugc-inno-nehu.com/
Click on image for a website of Aravamudhan

   BIODATA                    CONTACT INFO
   Curriculum Vitae/Resume     webpages_list
   http://nehuacin.tripod.com

Phone Mobile: +919862053872
EMAIL:- inboxnehu_sa@yahoo.com
                saravamudhan@hotmail.com
                aram1121944@gmail.com
Please download Java(tm).
For best view,display with:
zoom="100%"  :  text size="smallest"

NMR ARTICLE


The Users of the contents of this page are hereby requested to take due note of the Correspondences this author held with the publishers "Springer Verlag" in order to secure permission to reprint some of the Figures and tables from the book by K.H.Hausser and H.R.Kalbitzer on "NMR in Medicine and Biology" in the Physics in Life series published by Springer Verlag.
 CLICK HERE  to download the text of the correspondences with springer for a scrutiny. At present the printing of this article has not forthcome due to the pending matters on payments for grant permission under 'copy rights'.
An Elementary Introductory Article on
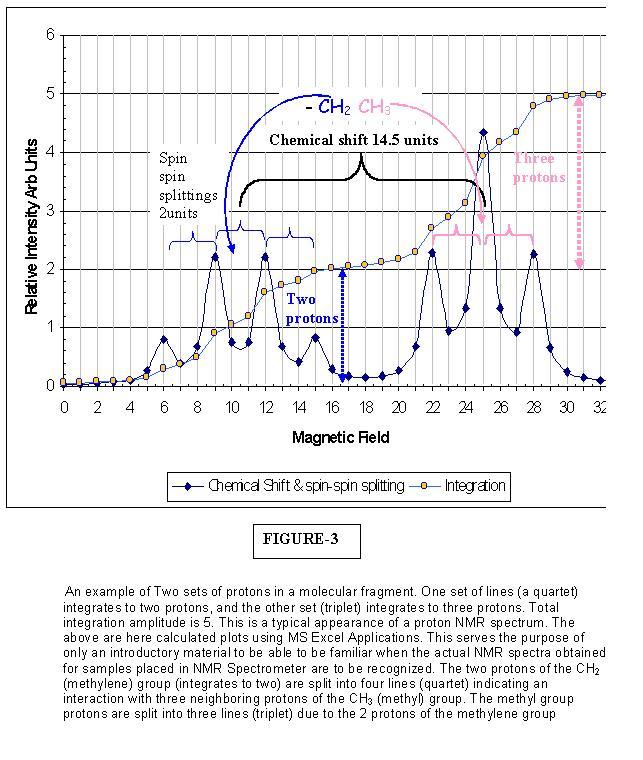
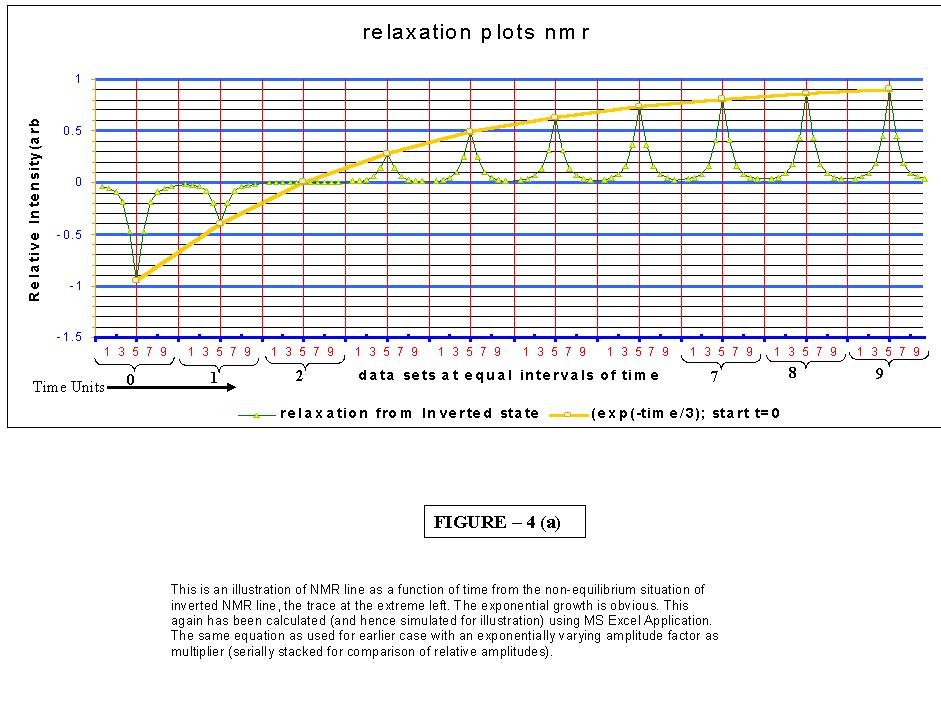
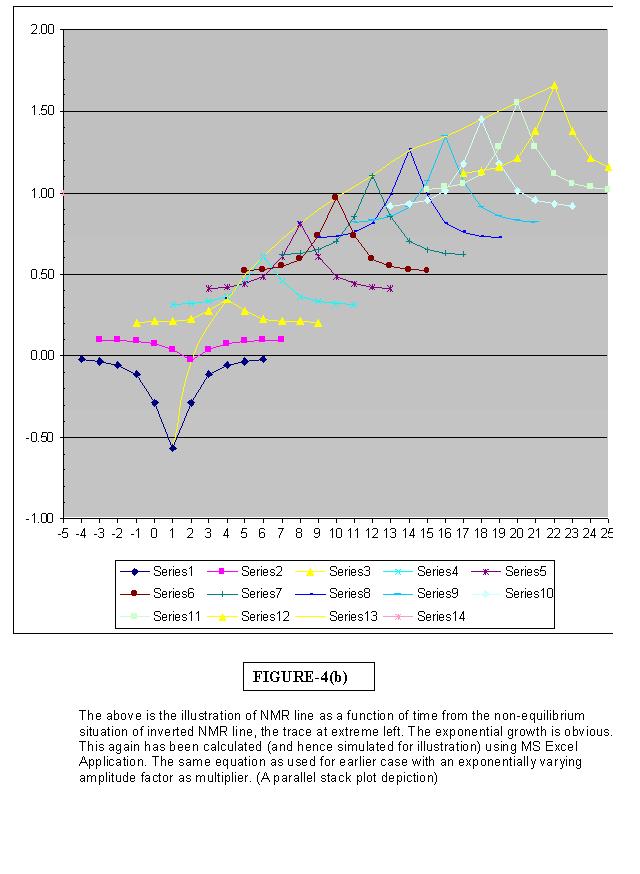
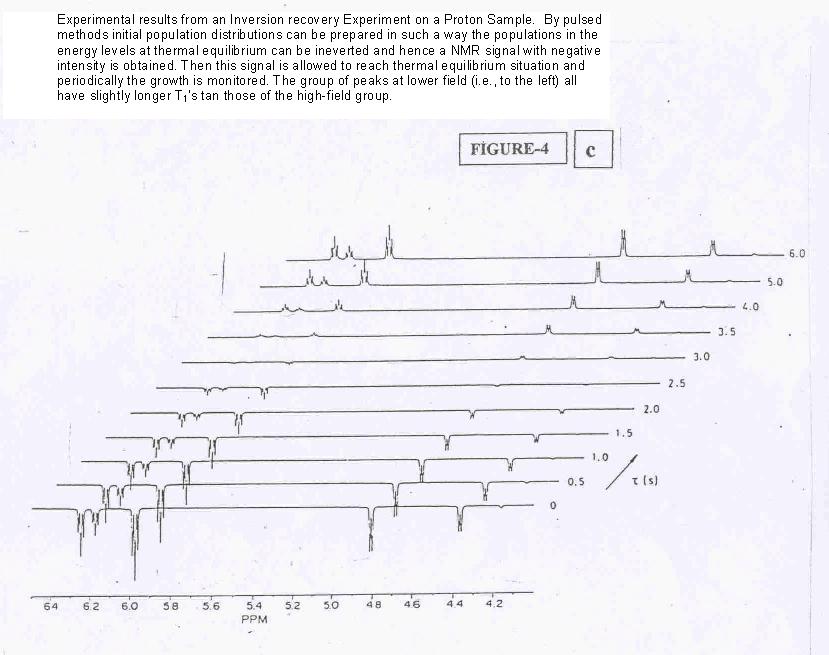
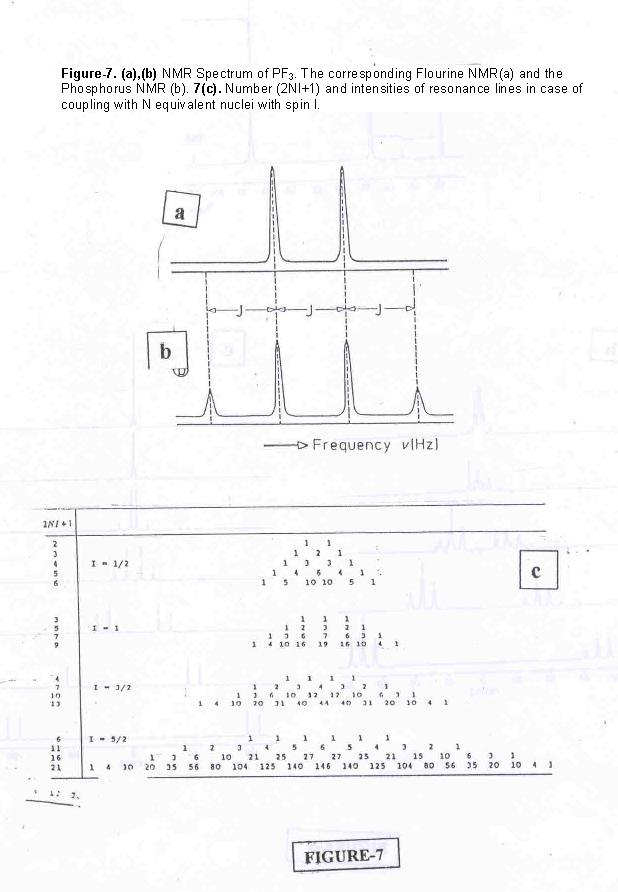
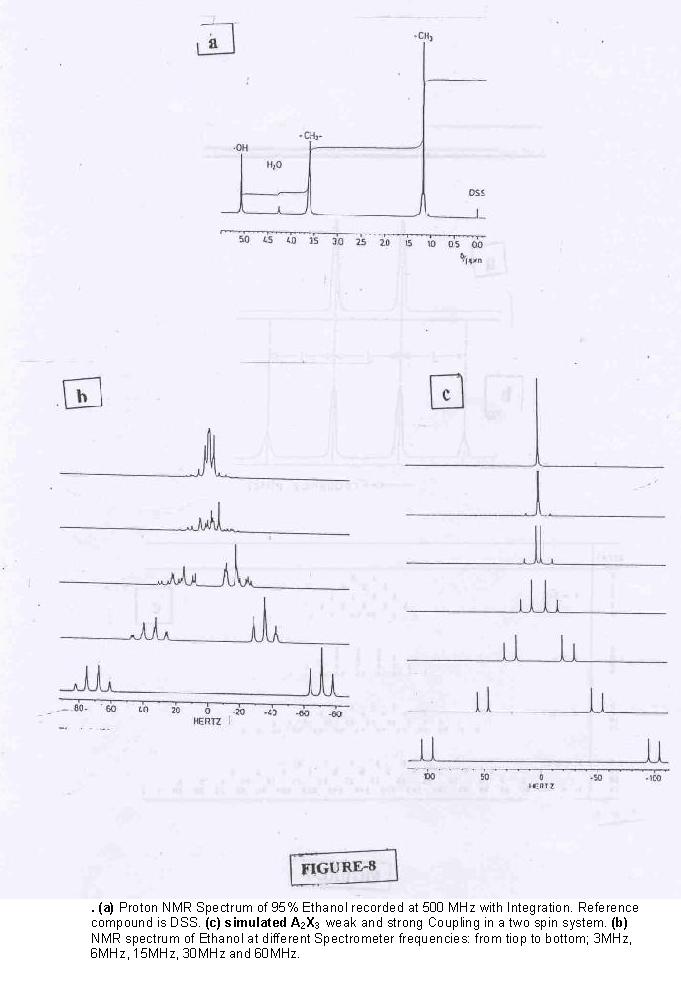
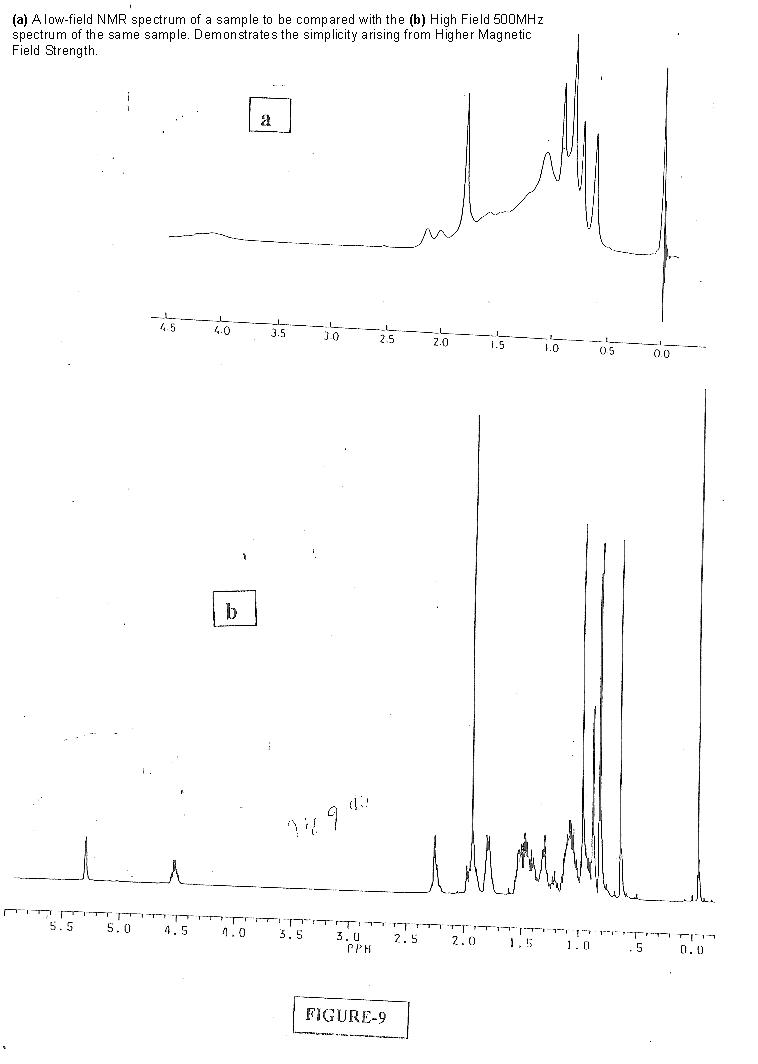
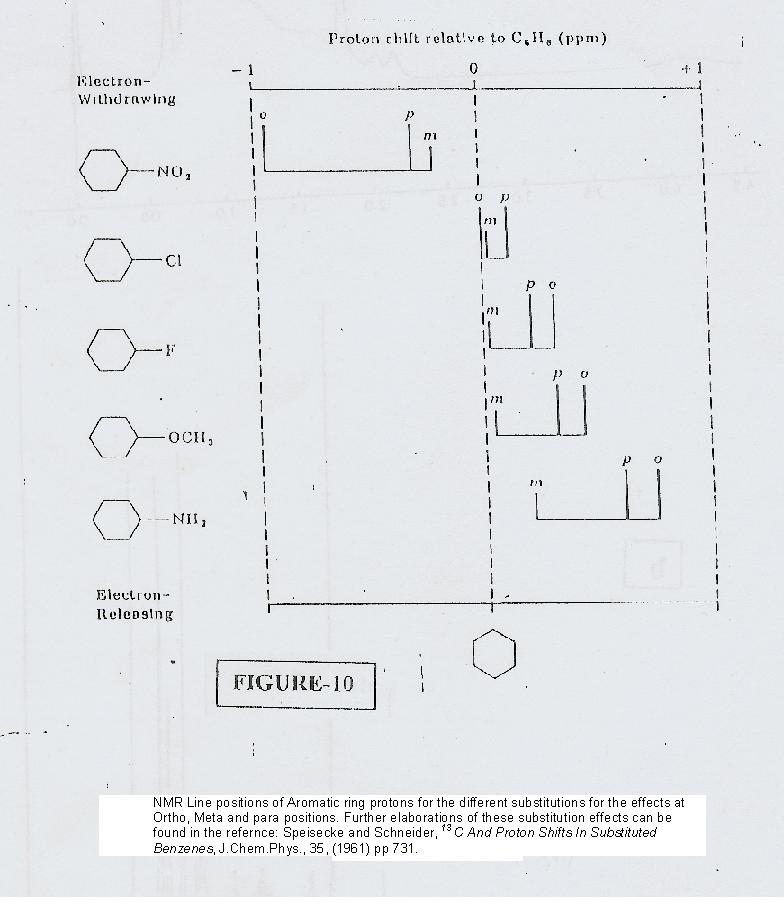
"Nuclear Magnetic Rsonance Spectroscopy as a Tool for Molecular Structure Determination"

Intended for Students of Physics with special emphasis on Biology and Medicine
By S.ARAVAMUDHAN, Department of Chemistry, North Eastern Hill University, Shillong 793022 Meghalaya INDIA
 CLICK HERE
to download the article on
"NMR as a Tool for Structure Determination"
Requires Adobe Acrobat Reader version 6.0
With a mouse right-click open in new window

You may CLICK HERE  to download the MS WORD document of this manuscript

The Figures referred in the text of the article are all not in this downloadable .pdf file
Figure and Table captions are listed on pages 21 & 22 of the article
These figures are provided in the table below as ".jpg" files
On pages 18 & 19 REFERENCES are listed and on page 20 items are listed as SUGGESTED READING
Below is an embedded documentation extracted from "http://www.youtube.co.in". Gives in 7mins 4secs a video illustration on the use of spectroscopy in structure ellucidation.Illustration with IR soectroscopy and Proton and carbon 13 NMR spectyroscopy.
Added on Sunday, December 21, 2008 by Dr. Aravamudhan at Shillong
To view the video movies made by Dr.S.Aravamudhan, CLICK on the link:  http://www.youtube.co.in  and in the homw page search box type 'aram1121944" and search for videoes.


Object added on December 21,2008

Find the above video embedded also at the Link:-   Multi Neuclear NMR and Toxic Heavy Elements
The layout of Figures in Table below
Inv_letr
Fig.1ab
Fig.2ab
Fig.2cd
Fig_3
Fig.4a
Fig.4b
Fig.4c
Fig.5a
Fig.5b
Fig.5c
Fig.6
Fig.7abc
Fig.8abc
Fig.9ab
Fig.10
Table_1
Table_2
Table_3
Table_4
Place the mouse-cursor on each of the images below. A mouse-over message would be displayed.
All Picture Images: Scanned at BIC,NEHU

CLICK HERE to display the Invitaion to write this article.Als read the request NOTE at the top of this page
Inv_letr
CLICK HERE to display Fig.1ab.Block Diagrams 'CW' and 'Pulsed-FT' NMR Spectrometers
Fig.1ab
CLICK HERE to display Fig_2ab. Simulated 13C-NMR Spectra
Fig.2ab
CLICK HERE to display Fig_2cd. simulated 13C-NMR Spectra
Fig.2cd
CLICK HERE to display Fig_3. NMR Spectrum 'CH3-CH2'; Chemical shifts, spin-spin coupling patterns and Integration.
Fig_3
CLICK HERE to display Fig_4a. Time-dependent exponential growth of inverted NMR signals
Fig.4a
CLICK HERE to display Fig_4b. Inversion recovery as in 4a. Relaxation
Fig.4b
CLICK HERE to display Fig_4c. Experimental Inversion-recovery Spectra
Fig.4c
CLICK HERE to display Fig_5a. Mechanism of Shielding:illustration
Fig.5a
CLICK HERE to display Fig_5b. Overlapping spectral lines. Calculation & plotting with MS EXCEL
Fig.5b
CLICK HERE to display Fig_5c. Exchange-effects in NMR spectra
Fig.5c
CLICK HERE to display Fig_6. A calculated NMR spectrum of Methanol
Fig_6
CLICK HERE to display Fig_7abc. 31P and 19F NMR Spctra of PF3.
Fig_7abc


CLICK HERE to display Fig_8abc./weak & strong coupling illustrations & experimental spectra
Fig_8abc
CLICK HERE to display Fig_9ab. Comparison of low-field and high-filed NMR spectra of same sample.
Fig_9ab
CLICK HERE to display Fig_10. substitution dependence of NMR chemical shifts of aromatic protons.
Fig_10
CLICK HERE to display Table_1. properties of important nuclei.
Table_1
CLICK HERE to display Table_2. Commonly used references in Biological NMR.
Table_2


CLICK HERE to display Table_3. Chemical shift assignments:protein NMR
Table_3
CLICK HERE to display Table_4.jpg. Chemical shift values of o,m, & protons for substituted benzene
Table_4.


Related Links on Magentic Resonance

http://www.geocities.com/saravamudhan1944/inno_course_contents.html

http://in.geocities.com/saravamudhan2002/nmr_for_oil_and_coal.html


http://www.angelfire.com/art3/saravamudhan/seminar_usic.html